FREE! Click here to Join FunTrivia. Thousands of games, quizzes, and lots more!
Quiz about Periodic Functions

Periodic Functions Trivia Quiz


Periodic functions have graphs which repeat themselves at regular intervals. Here are some graphs that illustrate some features of a specific periodic function, the sine curve. (Clicking on the graphs will make them larger and easier to read.)

A photo quiz by looney_tunes. Estimated time: 7 mins.
  1. Home
  2. »
  3. Quizzes
  4. »
  5. Science Trivia
  6. »
  7. Math
  8. »
  9. Specific Math Topics

Author
looney_tunes
Time
7 mins
Type
Photo Quiz
Quiz #
336,755
Updated
Nov 30 23
# Qns
10
Difficulty
Difficult
Avg Score
5 / 10
Plays
2056
Last 3 plays: patrickk (10/10), 4everett (9/10), Jdoerr (4/10).
-
Question 1 of 10
1. The diagram shows a unit circle, which means its radius is 1 unit long. The large dot shows the location of a point P which can move along the path of the circle. As it moves, its x- and y-coordinates change. We will measure how far it has travelled along the circle's circumference as t, and describe how the coordinates change as it moves. What are the coordinates of the point P at the start, when t=0? Hint


Question 2 of 10
2. This diagram shows the point P shortly after it has started moving in an anti-clockwise direction around a unit circle. It has covered a distance t, and its coordinates are (x,y). Lines have been added to show how P can be considered to be at one corner of a right-angled triangle whose horizontal leg is x units long, and whose vertical leg is y units long. Remembering that the circle has a radius of 1, and using the standard definitions of trigonometric ratios, which of the following is an algebraic expression for the cosine of the angle that this triangle forms at the centre of the circle (the angle marked with a small symbol)? Hint


Question 3 of 10
3. The sine function can be defined as the y-coordinate of a point moving around a unit circle (circle whose radius is 1) in an anti-clockwise direction. This graph of y = sin(t) can be seen to repeat itself after an interval called its period. As shown in the graph, which of these is closest to the period of this function? Hint


Question 4 of 10
4. The value of the sine function changes smoothly between two extreme values. The magnitude of its largest value is called the amplitude of the function. As shown in the graph, which of these is closest to the amplitude of the function y = sin(t)?


Hint


Question 5 of 10
5. By comparing the graphs for y = sin(t) and y = 2sin(t), what can be concluded about the probable shape of any graph y = Asin(t), where A is a positive number? Hint


Question 6 of 10
6. By comparing the graphs for y = sin(t) and y = -sin(t), what can be concluded about the effect of multiplying the function values by -1? Hint


Question 7 of 10
7. By comparing the graphs for y = sin(t), y = sin(2t) and y = sin(0.5t), what can you conclude about the probable shape of the graph of y = sin(nt), where n is a real number? Hint


Question 8 of 10
8. By comparing the graphs for y = sin(t) and y = sin(t) +2, what can you conclude about the probable shape of the graph of y = sin(t) + k, where k is a positive number? Hint


Question 9 of 10
9. By comparing the graphs of y = sin(t) and y = sin(t-2), what can you conclude about the probable shape of the graph of y = sin(t-h), where h is a positive number? Hint


Question 10 of 10
10. By comparing the graphs of y = sin(t) and y = sin(-t), how could their relationship be described? Hint


(Optional) Create a Free FunTrivia ID to save the points you are about to earn:

arrow Select a User ID:
arrow Choose a Password:
arrow Your Email:


View Image Attributions for This Quiz

Most Recent Scores
Apr 23 2024 : patrickk: 10/10
Apr 14 2024 : 4everett: 9/10
Apr 07 2024 : Jdoerr: 4/10
Mar 16 2024 : slay01: 10/10
Mar 16 2024 : Guest 172: 1/10
Mar 13 2024 : kingramstone: 7/10
Mar 09 2024 : Guest 85: 8/10

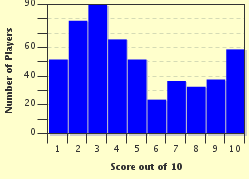
Score Distribution

quiz
Quiz Answer Key and Fun Facts
1. The diagram shows a unit circle, which means its radius is 1 unit long. The large dot shows the location of a point P which can move along the path of the circle. As it moves, its x- and y-coordinates change. We will measure how far it has travelled along the circle's circumference as t, and describe how the coordinates change as it moves. What are the coordinates of the point P at the start, when t=0?

Answer: (1,0)

The x-coordinate (the point on the x-axis which is lined up with the point) is always given first, followed by the y-coordinate. When t=0, x=1 and y=0, so the coordinates of P are given as (1,0).

When P has moved a quarter of the way around the circle (t=pi/2, which is a quarter of the circumference of 2*pi), it is at the point (0,1). Halfway around, when t=pi, the coordinates are (-1,0); three-quarters of the way around, when t=3*pi/2, the coordinates are (0,-1). When the point has completed a complete circle (t=2*pi), it is back where it started, at (1,0), and the patterns that describe its position start all over again.
2. This diagram shows the point P shortly after it has started moving in an anti-clockwise direction around a unit circle. It has covered a distance t, and its coordinates are (x,y). Lines have been added to show how P can be considered to be at one corner of a right-angled triangle whose horizontal leg is x units long, and whose vertical leg is y units long. Remembering that the circle has a radius of 1, and using the standard definitions of trigonometric ratios, which of the following is an algebraic expression for the cosine of the angle that this triangle forms at the centre of the circle (the angle marked with a small symbol)?

Answer: cos(t) = x/1

Since the cosine of an acute angle in a right-angled triangle is defined as the length of the leg adjacent to the angle divided by the length of the hypotenuse, in this case cos(t) = x/1. This means that at any point in its path, the value of the x-coordinate of point P is equal to the cosine of the angle t.

As P travels around the circle, its y-coordinate is equal to sin(t), the sine of t. This quiz will be exploring the sine curve in some detail. The ratio y/x, which describes the gradient of the radius from the centre of the circle to P, is tan(t), the tangent of t. The ratio x/y is called the cotangent of t, shown as cot(t). These are also periodic circular functions, but their properties will not be investigated in this quiz.
3. The sine function can be defined as the y-coordinate of a point moving around a unit circle (circle whose radius is 1) in an anti-clockwise direction. This graph of y = sin(t) can be seen to repeat itself after an interval called its period. As shown in the graph, which of these is closest to the period of this function?

Answer: 6.28

This quiz will measure all angles in radians, rather than the more familiar (to most) unit of degrees. A radian is defined as the angle which subtends an arc of 1 on a unit circle. If that doesn't make much sense, it's calculated as 180/pi (or about 57) degrees, slightly smaller than the angle in an equilateral triangle. Since we are actually talking about the distance a moving point travels along the circumference of a unit circle, radian is the appropriate unit in which to measure angles.

Since the travelling point whose position is being monitored repeats itself after completing a complete trip around the unit circle, its period is equal to the distance around the circle, which is 2*pi. As you can see from the graph, the value of 2*pi is roughly 6.28.
4. The value of the sine function changes smoothly between two extreme values. The magnitude of its largest value is called the amplitude of the function. As shown in the graph, which of these is closest to the amplitude of the function y = sin(t)?

Answer: 1

The function y = sin(t) varies in value between -1 and 1, so the magnitude (size) of its largest value is 1. The amplitude of the curve is actually defined as the maximum distance from the horizontal line that runs across the centre of the graph. The minimum value will always be as far below that line as the maximum value is above it.

In this case, that line has an equation of y = 0, so the amplitude is the same as the maximum value.
5. By comparing the graphs for y = sin(t) and y = 2sin(t), what can be concluded about the probable shape of any graph y = Asin(t), where A is a positive number?

Answer: The amplitude of y = Asin(t) will be A

The graph of y = 2sin(t) has a maximum value of 2, and a minimum value of -2. This means that its amplitude is 2. This graph and that of y = sin(t) both start at the point (1,0), so there has been no horizontal or vertical translation, and both have the same period, 2*p1.

It is a general rule that, for any positive number A, the amplitude of y = Asin(t) will be A. Hence, the graph of y = 0.734sin(t) has an amplitude of 0.734, while the graph of y = 1000sin(t) has an amplitude of 1000.
6. By comparing the graphs for y = sin(t) and y = -sin(t), what can be concluded about the effect of multiplying the function values by -1?

Answer: the graph will be reflected across the t-axis

All the values of y = -sin(t) are the same as those of y = sin(t) with the sign changed. The effect of this on the graph is to invert it. We describe this as reflection across the line in the middle of the pattern, the t-axis. A complete statement about the shape of the graph y = Asin(t) is that the curve will have an amplitude equal to the magnitude of A, and will be inverted if A is a negative number.
7. By comparing the graphs for y = sin(t), y = sin(2t) and y = sin(0.5t), what can you conclude about the probable shape of the graph of y = sin(nt), where n is a real number?

Answer: The period of y = sin(nt) will be (2*pi)/n

The period of y = sin(2t) can be seen to be approximately 3.14, or pi, which is (2*pi)/2. The period of y = sin (t/2), which is another way of writing y = sin(0.5t), can be seen to be approximately 12.56, or 4*pi. This is the same as (2*pi)*2, which is also the same as (2*pi)/0.5. As a general rule, the period of y = sin(nt) can be calculated to be (2*pi)/n for any real number n.
8. By comparing the graphs for y = sin(t) and y = sin(t) +2, what can you conclude about the probable shape of the graph of y = sin(t) + k, where k is a positive number?

Answer: The graph of y = sin(t) + k will be the same as the graph of y = sin(t), but moved k units vertically

As can be seen from the two graphs, both functions have the same period. The graph of y = sin(t) +2 has a maximum value of 3, and a minimum value of 1; the horizontal line across the middle of the curve has the equation y = 2. Its amplitude is unchanged at 1, but every point is 2 units higher than the corresponding point on the original curve. We describe this as vertical translation by 2 units. For any number k, the graph of y = sin(t) + k will be translated vertically by k units.

When k is positive, the graph moves up; when k is negative, it moves down.

Hence, the graph of y = sin(t) - 5 will move down 5 units, and have values that range between a minimum of -6 and a maximum of -4.
9. By comparing the graphs of y = sin(t) and y = sin(t-2), what can you conclude about the probable shape of the graph of y = sin(t-h), where h is a positive number?

Answer: The graph of y = sin(t-h) will be the same as the graph of y = sin(t), but moved h units to the right

If you trace the shape of the curve y = sin(t-2) starting at the point (2,0), you will see that it is the same shape as the curve of y = sin(t). This means that all values of the original curve have been moved to the right by 2 units. For any positive number h, the graph of y = sin(t-h) will be the same shape as the graph of y = sin(t) after translation to the right by h units. Similarly, the graph of y = sin(t+h) will be shifted to the left by h units.
10. By comparing the graphs of y = sin(t) and y = sin(-t), how could their relationship be described?

Answer: sin(-t) = -sin(t)

The two graphs are mirror images, reflections of each other across the t-axis. Every value of sin(-t) is the same size as the value of sin(t), but with the opposite sign. We describe functions for which f(-x) = -f(x) as odd functions, because polynomials of an odd degree (y = x, y = x^3, y = x^5, etc.) are examples of odd functions. Sine is an odd function.

The cosine function is said to be an even function because cos(-t) = cos(t), similar to the even degree (y = x^2, y = x^4, etc.) polynomials, for which f(-x) = f(x). Tangent, like sine, is an odd function.
Source: Author looney_tunes

This quiz was reviewed by FunTrivia editor crisw before going online.
Any errors found in FunTrivia content are routinely corrected through our feedback system.
Related Quizzes
This quiz is part of series Maths Challenges:

A collection of quizzes aimed at players with a high school level of mathematics who are interested in exploring the world of mathematics.

  1. Transcendental Numbers Average
  2. Perfect and Not-So-Perfect Numbers Tough
  3. The Matrix Average
  4. Periodic Functions Difficult
  5. Shapes From Squares Average
  6. You Derive Me Crazy! Average
  7. What's My Number? Average
  8. What's My Type? Average

4/24/2024, Copyright 2024 FunTrivia, Inc. - Report an Error / Contact Us