FREE! Click here to Join FunTrivia. Thousands of games, quizzes, and lots more!
Quiz about Sabermetrics for Dummies  2006 Edition

Sabermetrics for Dummies : 2006 Edition Quiz


This is a quiz on "sabermetrics" baseball statistics that use unconventional measures of performance. Answers are based on 2006 statistics. I hope you enjoy it.

A multiple-choice quiz by beanster. Estimated time: 4 mins.
  1. Home
  2. »
  3. Quizzes
  4. »
  5. Sports Trivia
  6. »
  7. MLB in the 2000s
  8. »
  9. MLB 2006

Author
beanster
Time
4 mins
Type
Multiple Choice
Quiz #
255,048
Updated
Dec 03 21
# Qns
10
Difficulty
Easy
Avg Score
8 / 10
Plays
1482
Awards
Top 20% Quiz
- -
Question 1 of 10
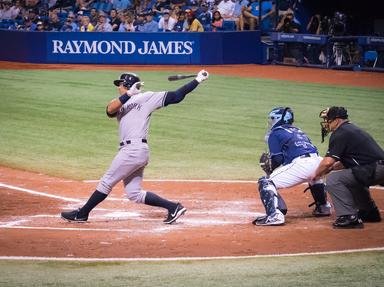
1. The New York Yankees' Jason Giambi had a batting average of just .253 in 2006, but was able to reach base over 41 percent of the time, or more often than all but five players in the American League. The difference between his batting average and on-base percentage or OBP is best explained by his number of these. Hint


Question 2 of 10
2. Pittsburgh's Freddy Sanchez won the 2006 National League batting title, but his .841 OPS was a whopping 261 points below league leader Albert Pujols of St. Louis. OPS is a combination of a player's on-base percentage and which other statistic? Hint


Question 3 of 10
3. The 2006 American League leader in OPS was which Cleveland Indians designated hitter who posted an OPS above 1.000 for the second straight year? Hint


Question 4 of 10
4. Many people trace the recent surge in popularity of "sabermetrics" statistics to Michael Lewis' book "Moneyball". It chronicled the highly successful implementation of this approach by this perennially low budget franchise and its general manager Billy Beane. Which team was it about? Hint


Question 5 of 10
5. This oddly-named statistic measured how many Hits and Walks a pitcher gives up on average for every inning pitched. Hint


Question 6 of 10
6. Sabermetricians have developed pitching statistics like Fielding Independent Pitching (FIP) as an alternative to the traditional Earned Run Average (ERA) to better account for which of the following? Hint


Question 7 of 10
7. Traditional measures of fielding rely on potentially subjective factors such as errors, which may not account for how many plays a player should have made relative to the average player at his position. As a result, sabermetrics experts often disagree with recipients of which award for the top defensive player at each position? Hint


Question 8 of 10
8. Stolen bases are another favorite sabermetrics topic, with efficiency (in terms of not being caught) being considered at least as important as the number of stolen bases. The authors of the book, "Baseball Between the Numbers", argue that notoriously slow-footed Pete Incaviglia's career base running record actually compared favorably with which speedy player, who exceeded Lou Brock's previous record by over 400 stolen bases? Hint


Question 9 of 10
9. A central concept for evaluating a player's contribution to a team is how many wins (as calculated by various complex formulas) a player contributes compared to the average "replacement player", using statistics like VORP or Value Over Replacement Player. A replacement player generally refers to what? Hint


Question 10 of 10
10. Not everyone buys into the validity or usefulness of these new statistics. This former Cincinnati Red and Hall of Fame second baseman famously uttered, "Anytime you're trying to make statistics to tell you who's gonna win the game, that's a bunch of geeks trying to play video games." Who said this? Hint


(Optional) Create a Free FunTrivia ID to save the points you are about to earn:

arrow Select a User ID:
arrow Choose a Password:
arrow Your Email:


Quiz Answer Key and Fun Facts
1. The New York Yankees' Jason Giambi had a batting average of just .253 in 2006, but was able to reach base over 41 percent of the time, or more often than all but five players in the American League. The difference between his batting average and on-base percentage or OBP is best explained by his number of these.

Answer: Walks

A walk may not be exactly as good as a hit, but Giambi's 110 walks, a result of his disciplined hitting approach, are factored into his OBP but not his batting average.
2. Pittsburgh's Freddy Sanchez won the 2006 National League batting title, but his .841 OPS was a whopping 261 points below league leader Albert Pujols of St. Louis. OPS is a combination of a player's on-base percentage and which other statistic?

Answer: Slugging Percentage

OPS is a measure of a player's offensive contribution by adding together his ability to get on base (OBP), with a measure of his extra base hits as measured by slugging percentage (total bases divided by at-bats). By including things like walks, doubles and home runs, it provides a more complete yardstick than simple batting average.
3. The 2006 American League leader in OPS was which Cleveland Indians designated hitter who posted an OPS above 1.000 for the second straight year?

Answer: Travis Hafner

The much better known David Ortiz of the Boston Red Sox was the only other AL player besides Hafner to post an OPS above 1.000 in both 2005 and 2006.
4. Many people trace the recent surge in popularity of "sabermetrics" statistics to Michael Lewis' book "Moneyball". It chronicled the highly successful implementation of this approach by this perennially low budget franchise and its general manager Billy Beane. Which team was it about?

Answer: Oakland Athletics

These type of statistics have actually been in circulation and refined over several decades through the work of pioneers, such as Bill James and the Society for American Baseball Research (or SABR, hence the term "sabermetrics").
5. This oddly-named statistic measured how many Hits and Walks a pitcher gives up on average for every inning pitched.

Answer: WHIP

WHIP measures the total number of walks and hits per innings pitched. In 2006, Minnesota's Johan Santana had a league-leading WHIP of 1.00 while Baltimore's Daniel Cabrera had a WHIP of 1.58, despite giving up less than one hit per inning because he walked 104 batters in just 148 innings. Over the course of a 200-inning season, this difference between Santana and Cabrera would translate into 116 additional baserunners.
6. Sabermetricians have developed pitching statistics like Fielding Independent Pitching (FIP) as an alternative to the traditional Earned Run Average (ERA) to better account for which of the following?

Answer: All these

In order to make better projections and comparisons among pitchers, measures like Fielding Independent Pitching (FIP) attempt to isolate the things that a pitcher is specifically responsible for like strikeouts while eliminating or reducing the impact of factors outside his control, such as his teammates' defense.
7. Traditional measures of fielding rely on potentially subjective factors such as errors, which may not account for how many plays a player should have made relative to the average player at his position. As a result, sabermetrics experts often disagree with recipients of which award for the top defensive player at each position?

Answer: Gold Glove

Alternative measures of defense such as range factor look at how many plays each player made (as measured by putouts and assists), compared to how many innings they played.
8. Stolen bases are another favorite sabermetrics topic, with efficiency (in terms of not being caught) being considered at least as important as the number of stolen bases. The authors of the book, "Baseball Between the Numbers", argue that notoriously slow-footed Pete Incaviglia's career base running record actually compared favorably with which speedy player, who exceeded Lou Brock's previous record by over 400 stolen bases?

Answer: Rickey Henderson

Sabermetrics places a great emphasis on not making outs, so a runner's ability to avoid outs may outweigh the potential extra base. One way of doing this is to break down every possible game situation into how much an action such as a stolen base, home run or strikeout increases or decreases a team's probability of winning the game.
9. A central concept for evaluating a player's contribution to a team is how many wins (as calculated by various complex formulas) a player contributes compared to the average "replacement player", using statistics like VORP or Value Over Replacement Player. A replacement player generally refers to what?

Answer: An average bench or Triple-A player at the same position

VORP is potentially one of the most useful and powerful tool in evaluating the value of a player. Since there is generally an abundance of "replacement" level talent available, it's a player's ability to contribute above that level that really counts.

For example, a player who hits 30 home runs per year may be relatively more valuable to a team as a second baseman than as a first baseman because of the scarcity of home run hitters at that position.
10. Not everyone buys into the validity or usefulness of these new statistics. This former Cincinnati Red and Hall of Fame second baseman famously uttered, "Anytime you're trying to make statistics to tell you who's gonna win the game, that's a bunch of geeks trying to play video games." Who said this?

Answer: Joe Morgan

Morgan, after retiring became a prominent ESPN baseball commentator, has drawn the ire of sabermetrics practitioners for comments like this, and even inspired a blog titled, "Fire Joe Morgan", dedicated to critiquing sports journalism.
Source: Author beanster

This quiz was reviewed by FunTrivia editor Nightmare before going online.
Any errors found in FunTrivia content are routinely corrected through our feedback system.
4/26/2024, Copyright 2024 FunTrivia, Inc. - Report an Error / Contact Us