FREE! Click here to Join FunTrivia. Thousands of games, quizzes, and lots more!
Quiz about An Ominous Sine

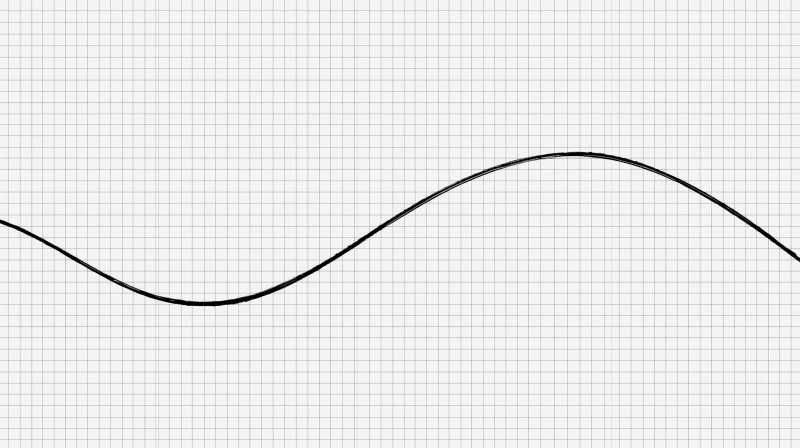
An Ominous Sine Trivia Quiz


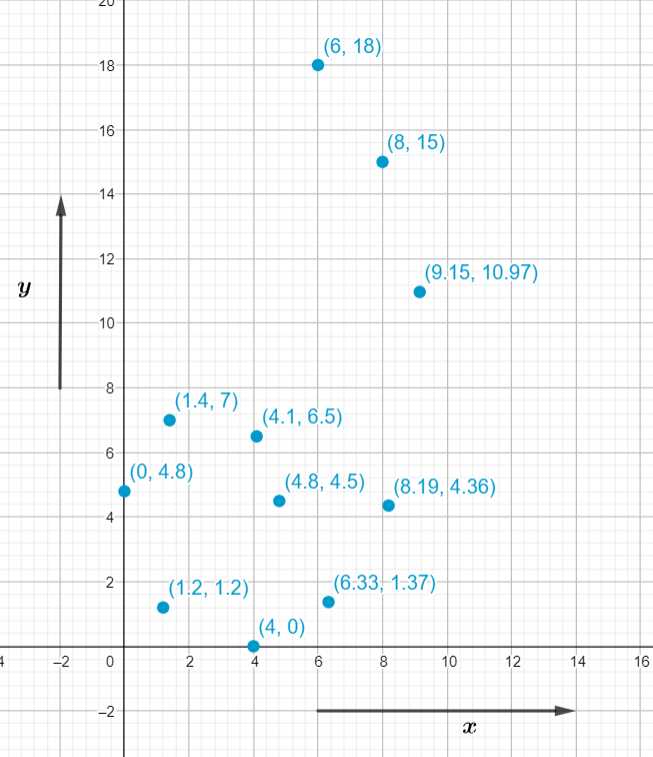
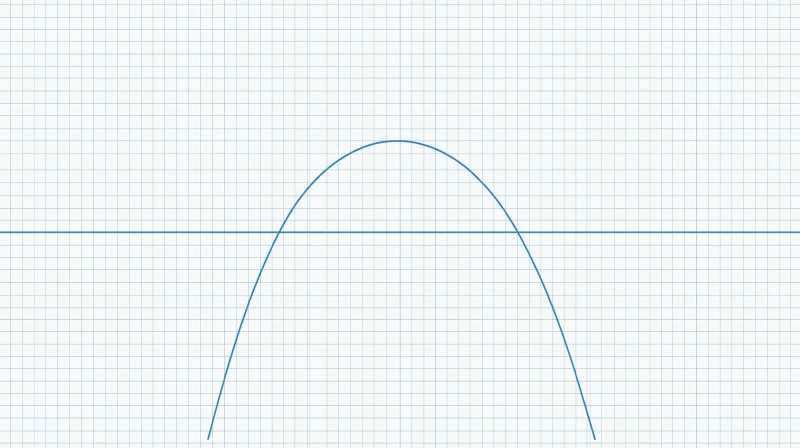
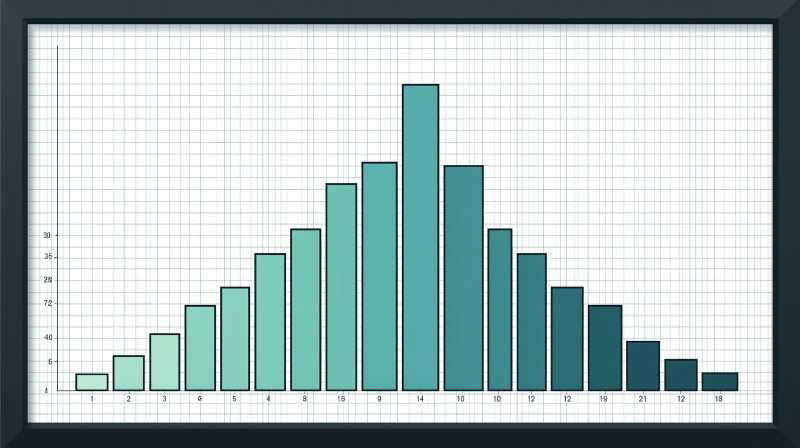
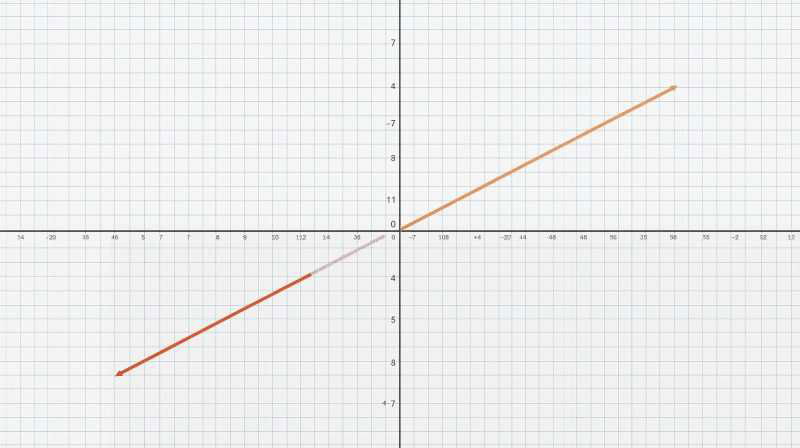
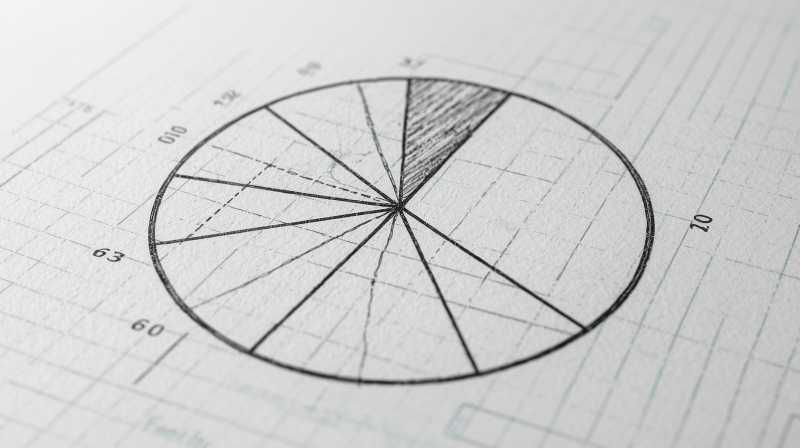
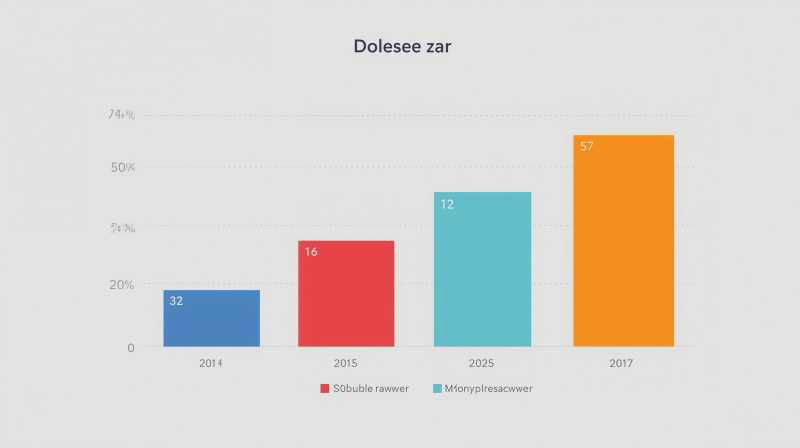
Remember in high school math, all of those crazy graphs you had to learn in algebra, geometry, statistics, and maybe even calculus? All you've got to do is match up the standard graph to what its mathematical name is. I promise you won't need a calculato

by GBfan. Estimated time: 3 mins.
  1. Home
  2. »
  3. Quizzes
  4. »
  5. Science Trivia
  6. »
  7. Math
  8. »
  9. Mixed Math

Author
GBfan
Time
3 mins
Type
Quiz #
423,213
Updated
Feb 26 26
# Qns
10
Difficulty
Very Easy
Avg Score
9 / 10
Plays
36
Last 3 plays: cardsfan_027 (10/10), Wildcat393 (10/10), Guest 209 (5/10).
Drag-Drop or Click from Right
Options
Ellipse equation Scatterplot Box-and-whiskers Cube graph Quadratic equation Sine curve Linear equation Histogram Pie graph Bar graph


 View Image Attributions for This Quiz

Most Recent Scores
Today : cardsfan_027: 10/10
Today : Wildcat393: 10/10
Today : Guest 209: 5/10
Today : Guest 66: 8/10
Today : ceetee: 10/10
Today : sally0malley: 8/10
Today : rlandi1: 7/10
Today : Guest 98: 10/10
Today : pixiecat: 10/10

Quiz Answer Key and Fun Facts
1. Scatterplot

A scatterplot is a series of coordinate points on a Cartesian plane. Based on the scatterplot, you are likely to determine if the data has a positive or negative slope and can potentially find a line of best fit.
2. Quadratic equation

The general form of the quadratic equation is Y = A(X-H)^2 + K. The graph of a quadratic equation is a parabola. If the A value is positive, the graphs looks like the letter U. If the A value is negative, you'd see the graph pictured here.
3. Sine curve

The name of the quiz "An Ominous Sine" gets represented here with the trigonometry graph for the y = Sin x graph. The graph for the sine and cosine graphs are the same except for a horizontal shift.
4. Histogram

A histogram is a special form of a bar graphs where the bars touch each other. These are used to represent numeral data. In the picture shown, we are also able to see that the graph is approximately normally distributed.
5. Linear equation

The general equation of a linear equation is y = mx + b in slope-intercept form or Ax + By = C in standard form. The points have a consistent slope value that are either positive, negative, or a zero slope. A graph with a zero slope is a horizontal line.
6. Pie graph

To represent categorical data, you may want to create a pie graph. Each sector of the pie graph is a percentage of the 360 degrees of the circle. For example, 25% of a data set would equal 90 degrees on the pie graph.
7. Ellipse equation

In the real world, many things that look like circles are actually ellipses. The mathematical equations for each are similar but an ellipse is more of a "squashed" circle where it's not perfectly equal. You learn about ellipse graphs when studying conic sections.
8. Bar graph

Bar graphs are used to represent categorical data, not quantitative. The goal of a bar graph is to visually compare the percentages of each category. When constructing a bar graph, it is essential that the bars do not touch each other and that labels are given on the paper.
9. Cube graph

Graphing a three dimensional cube is not a common occurrence in math class. But you are essentially constructing two identical squares that are slightly above and translated right from each other. This type of graph could be seen more often in a drafting class for architecture.
10. Box-and-whiskers

A box-and-whiskers graph is also known as a boxplot. The graph is used for quantitative data in statistics and allows the viewer to identify the five number summary of the data. You can easily see where the median and extreme values occur in the data set.
Source: Author GBfan

This quiz was reviewed by FunTrivia editor rossian before going online.
Any errors found in FunTrivia content are routinely corrected through our feedback system.
Related Quizzes
1. Double Check Your Work Very Easy
2. The Year 2025 Average
3. A Numbers Game Average
4. Greek and Latin in Mathematics Average
5. The Answer Average
6. Fun with Numbers! Average
7. Equations & Maths by The Calculators! Average
8. Weapons Of Math Destruction Average
9. The Year 2026 Average
10. Two, Four, Six, Eight! Average
11. What is the Smallest? Average
12. Mathematical Madness Average

2/26/2026, Copyright 2026 FunTrivia, Inc. - Report an Error / Contact Us